Symptom Tracking
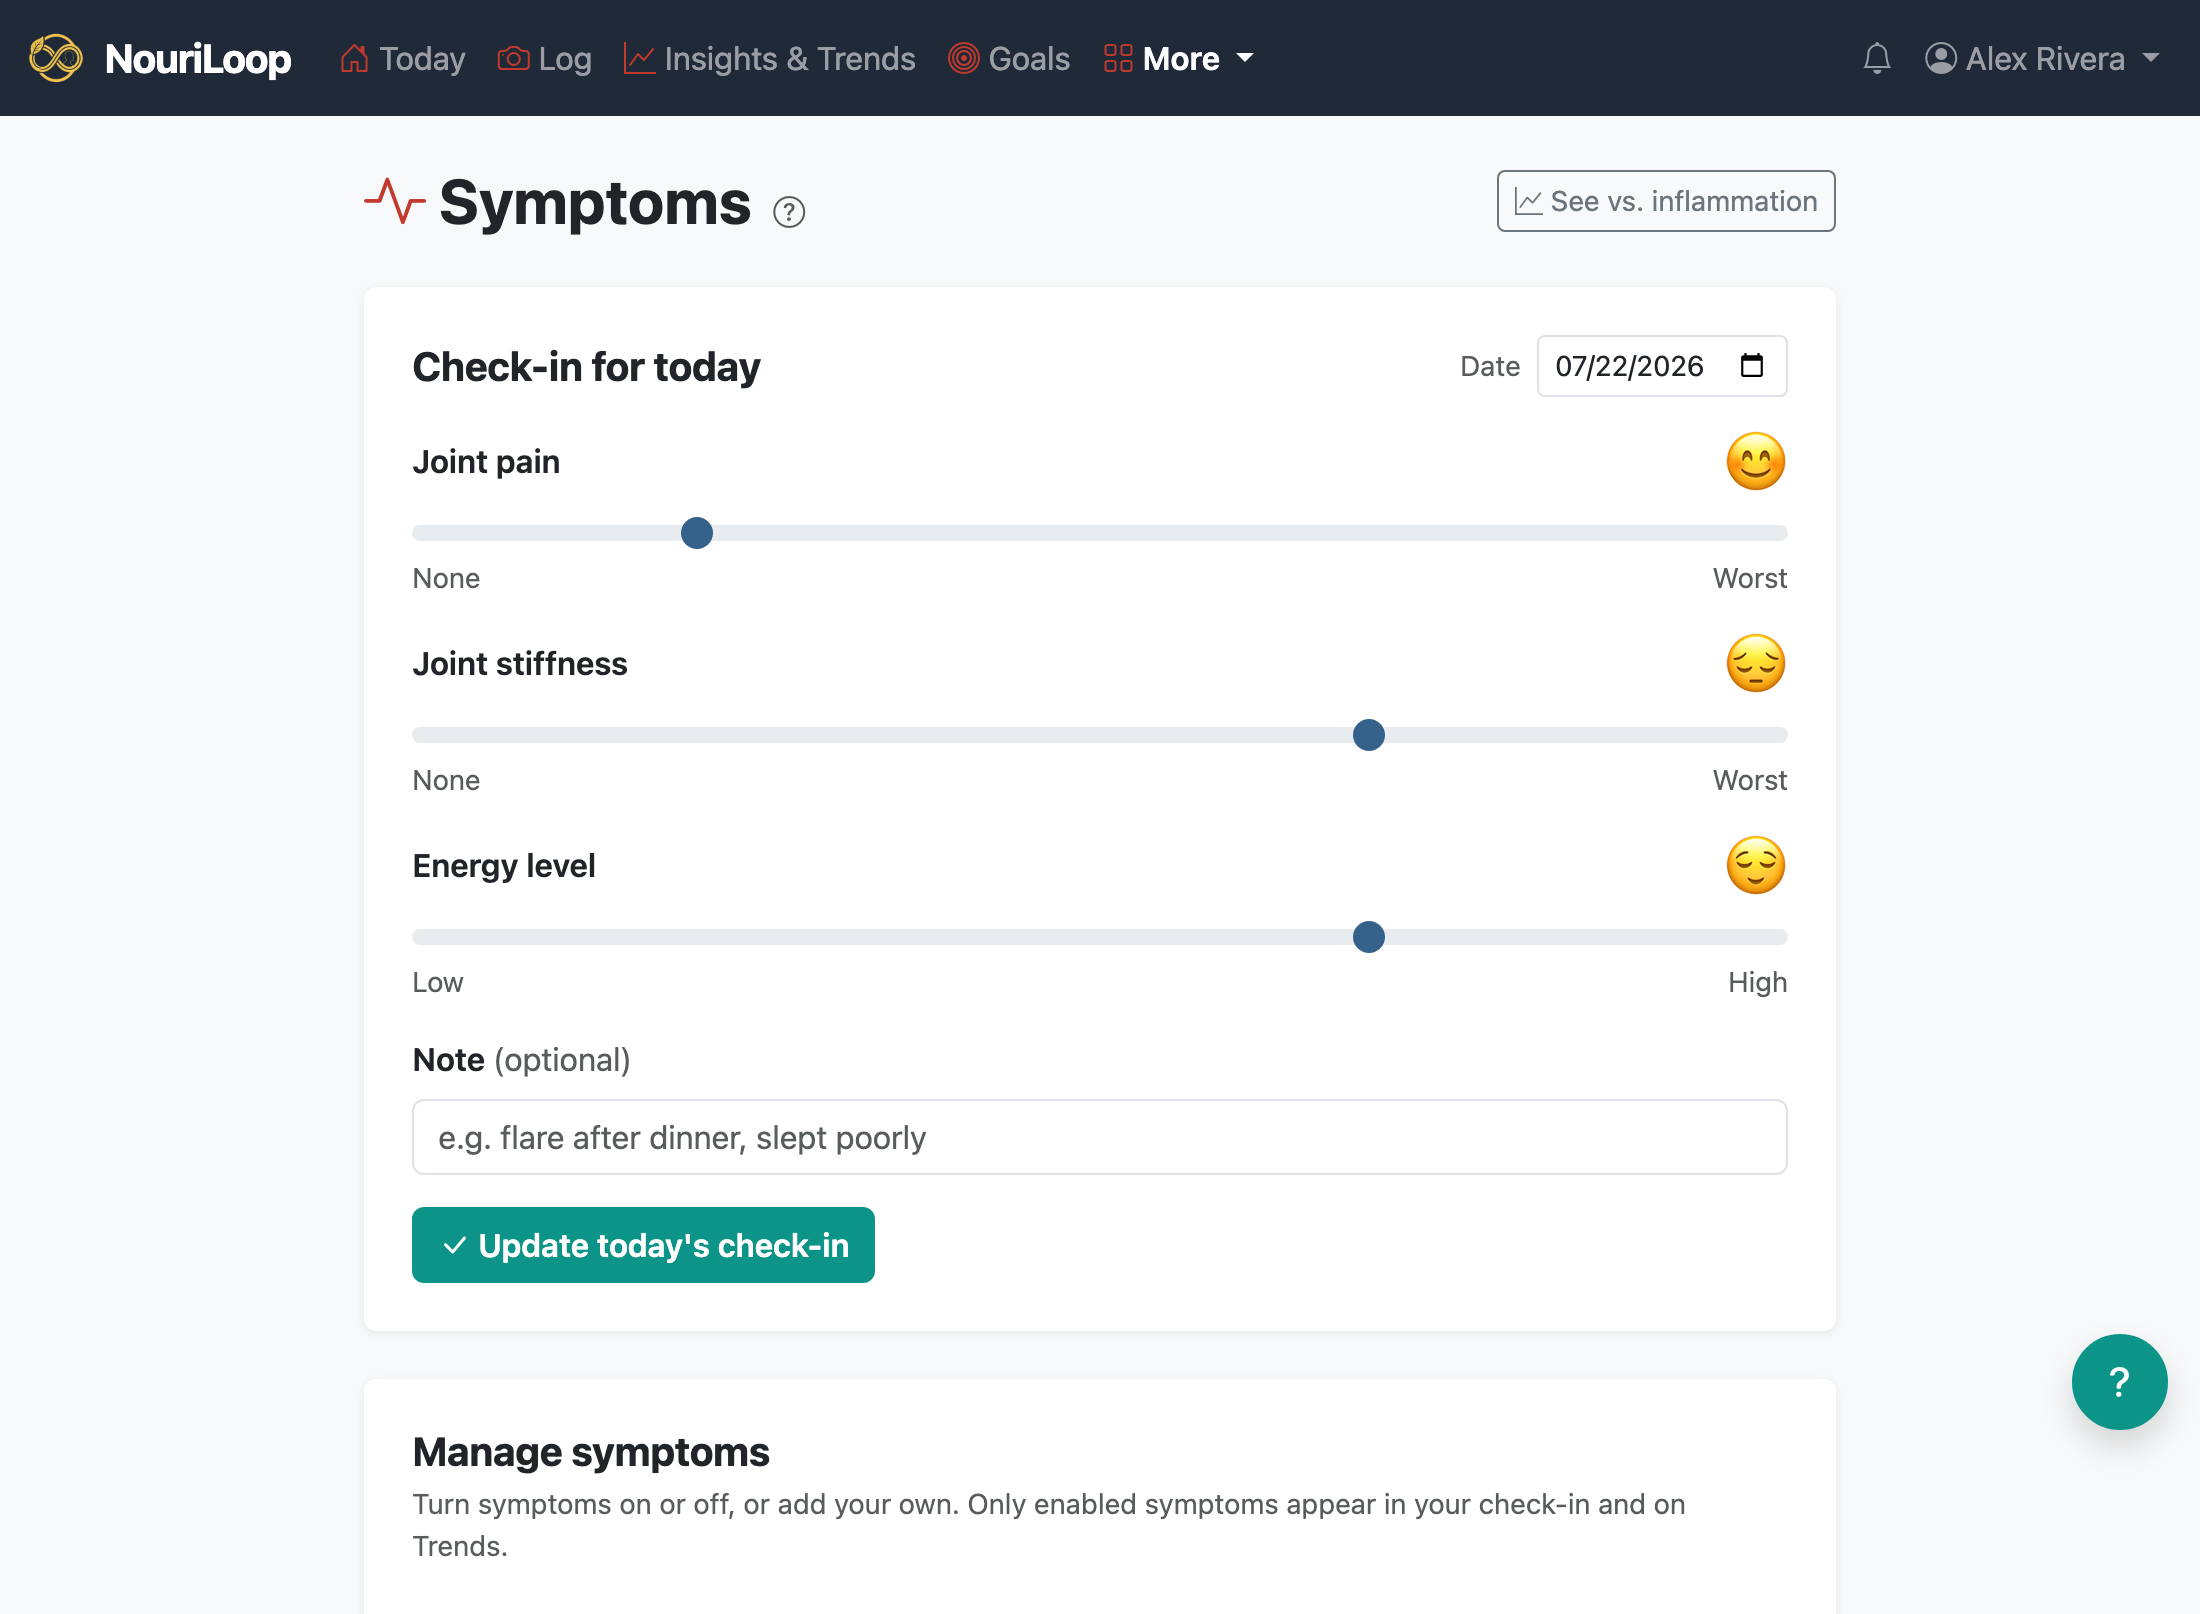
Symptom tracking closes the loop between what you eat and how you feel. You pick the symptoms that matter to you, rate them daily, and NouriLoop looks for connections with your diet.
Getting started
- Open the Symptoms page.
- In Manage symptoms, turn on the ones you care about — joint pain, stiffness, bloating, headache, energy, mental clarity — or add your own.
- Each day, slide each symptom from 0 to 10. For "good" symptoms like energy, a higher number is better; for others, lower is better.
Reading the relationship charts
Once you've logged a symptom for a few days, it gets its own tile on Insights & Trends. Tapping the tile opens a panel like this one for joint stiffness:
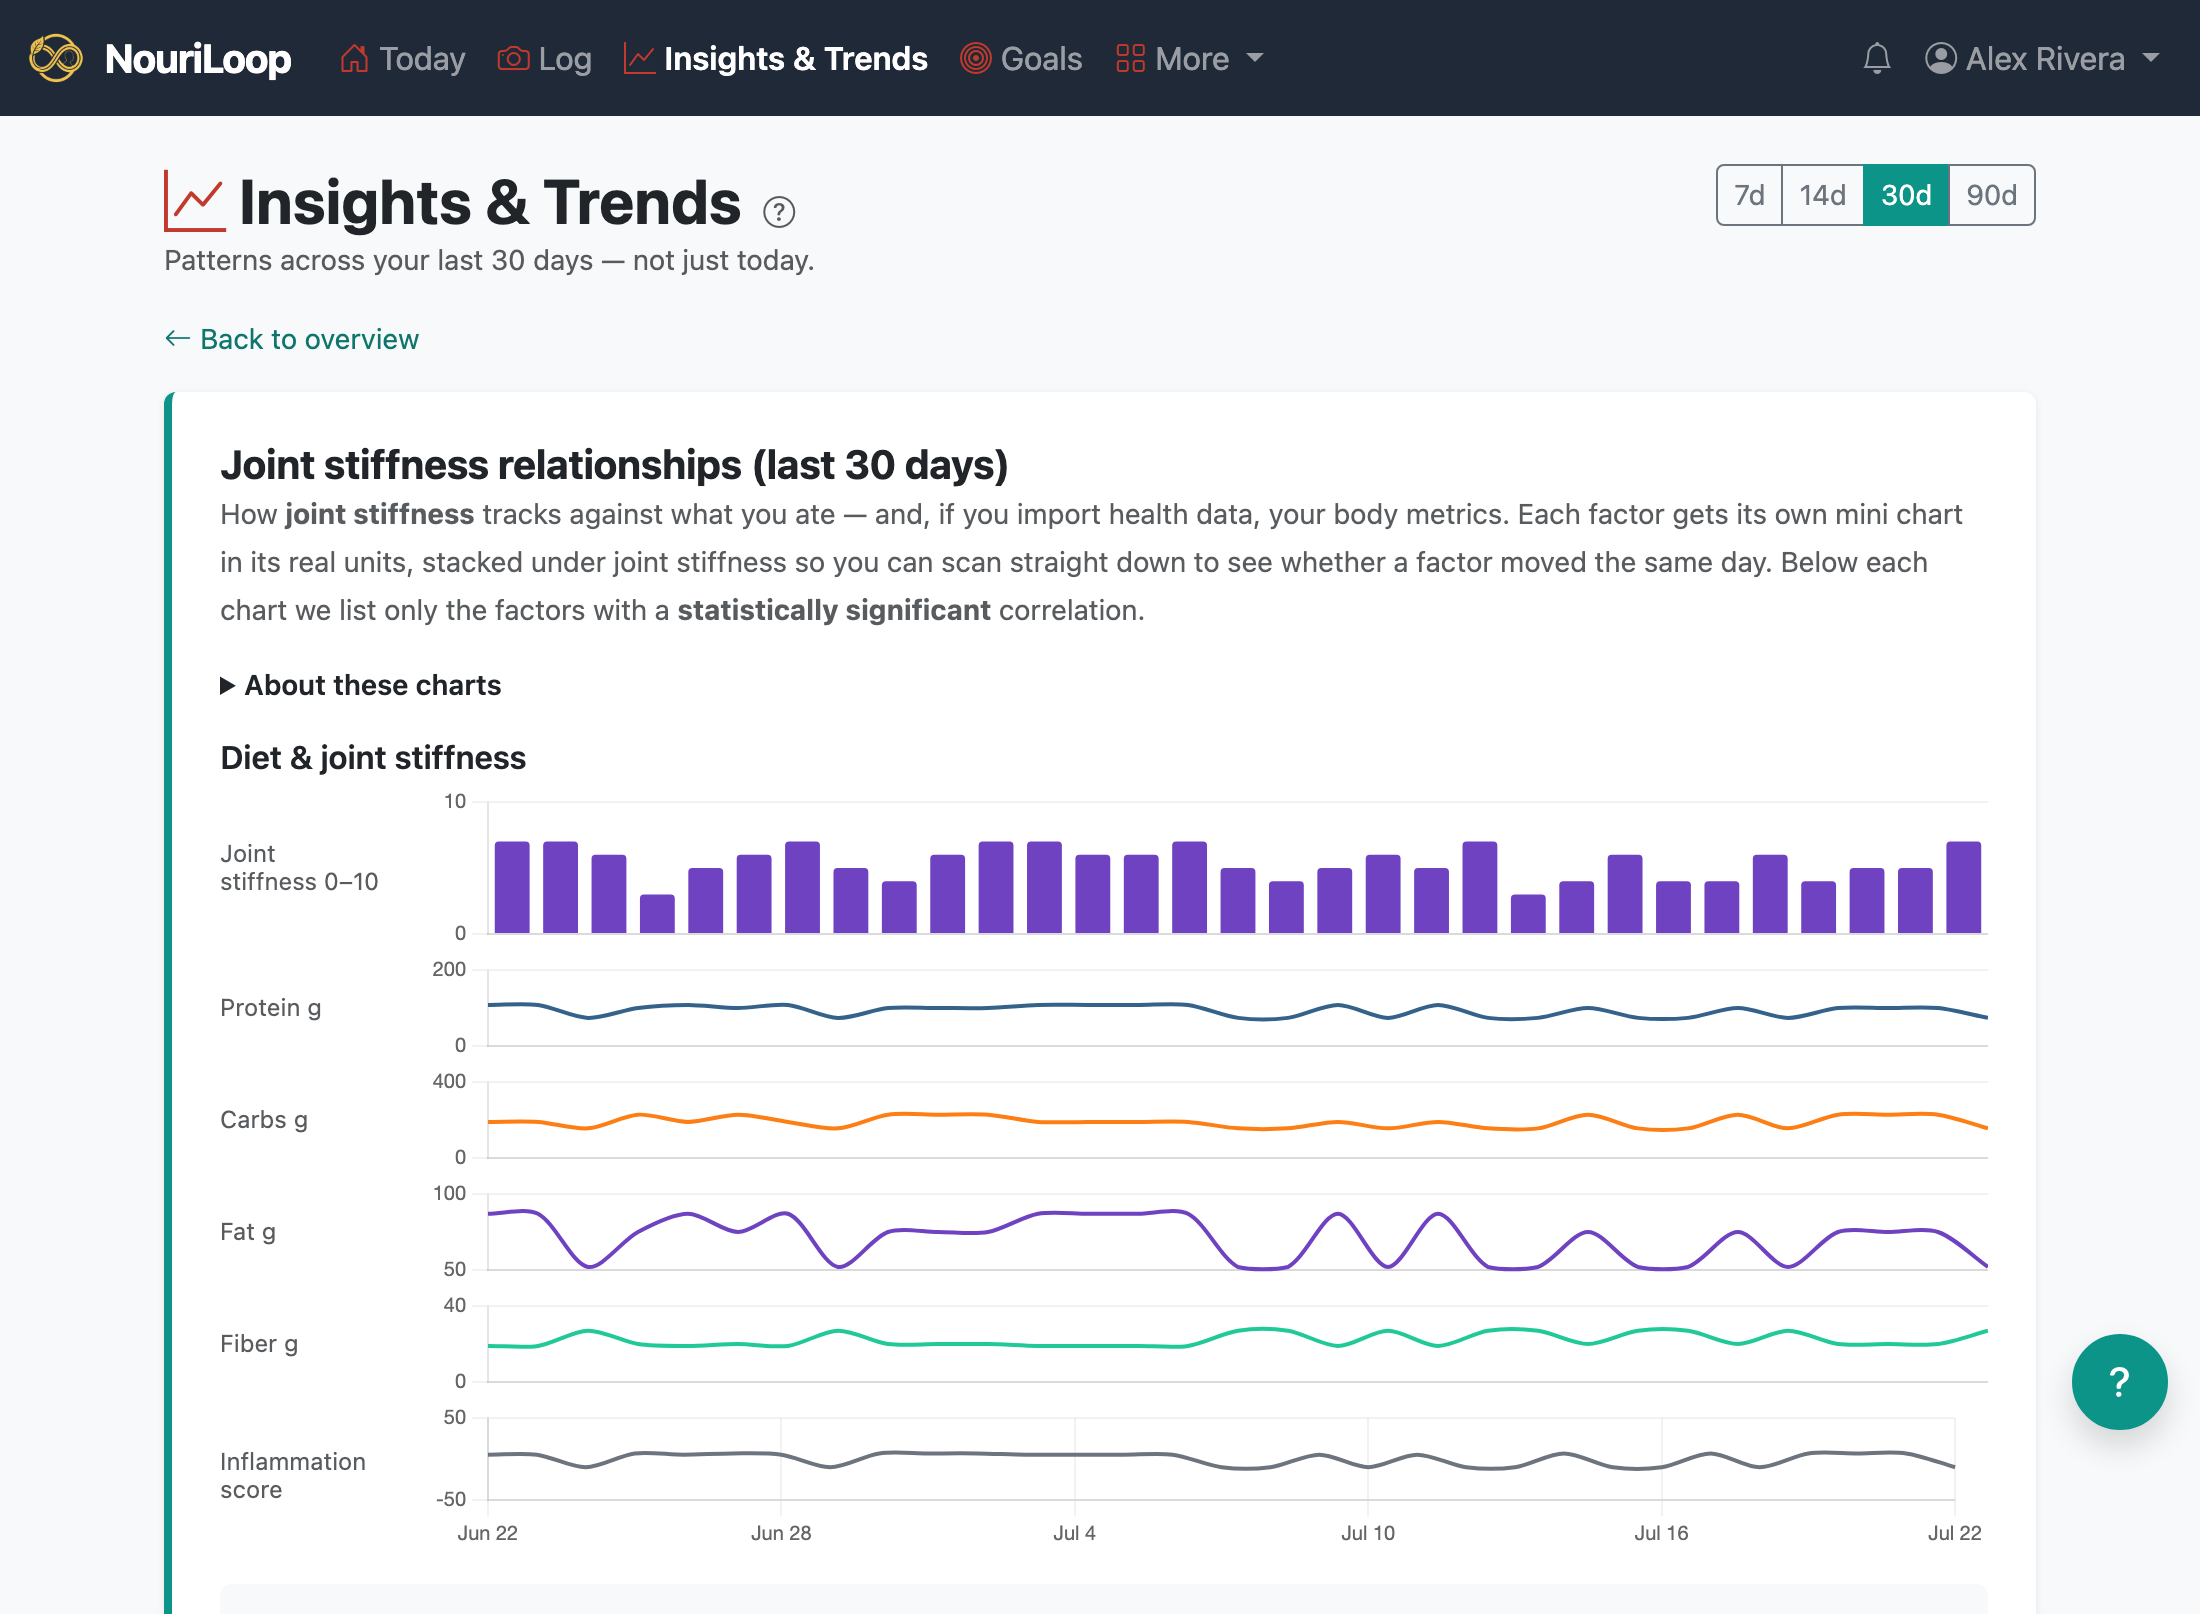
Each factor — diet macros, your inflammation score, and (if you import them) health metrics like sleep or steps — gets its own compact chart in its real units, stacked directly under the symptom. Rather than untangling several lines squashed onto one shared, normalized axis, you scan straight down a column: does a spike in the symptom line up with a spike — or a dip — just below it?
What "statistically significant" means
Below each chart, NouriLoop calls out only the factors worth your attention:
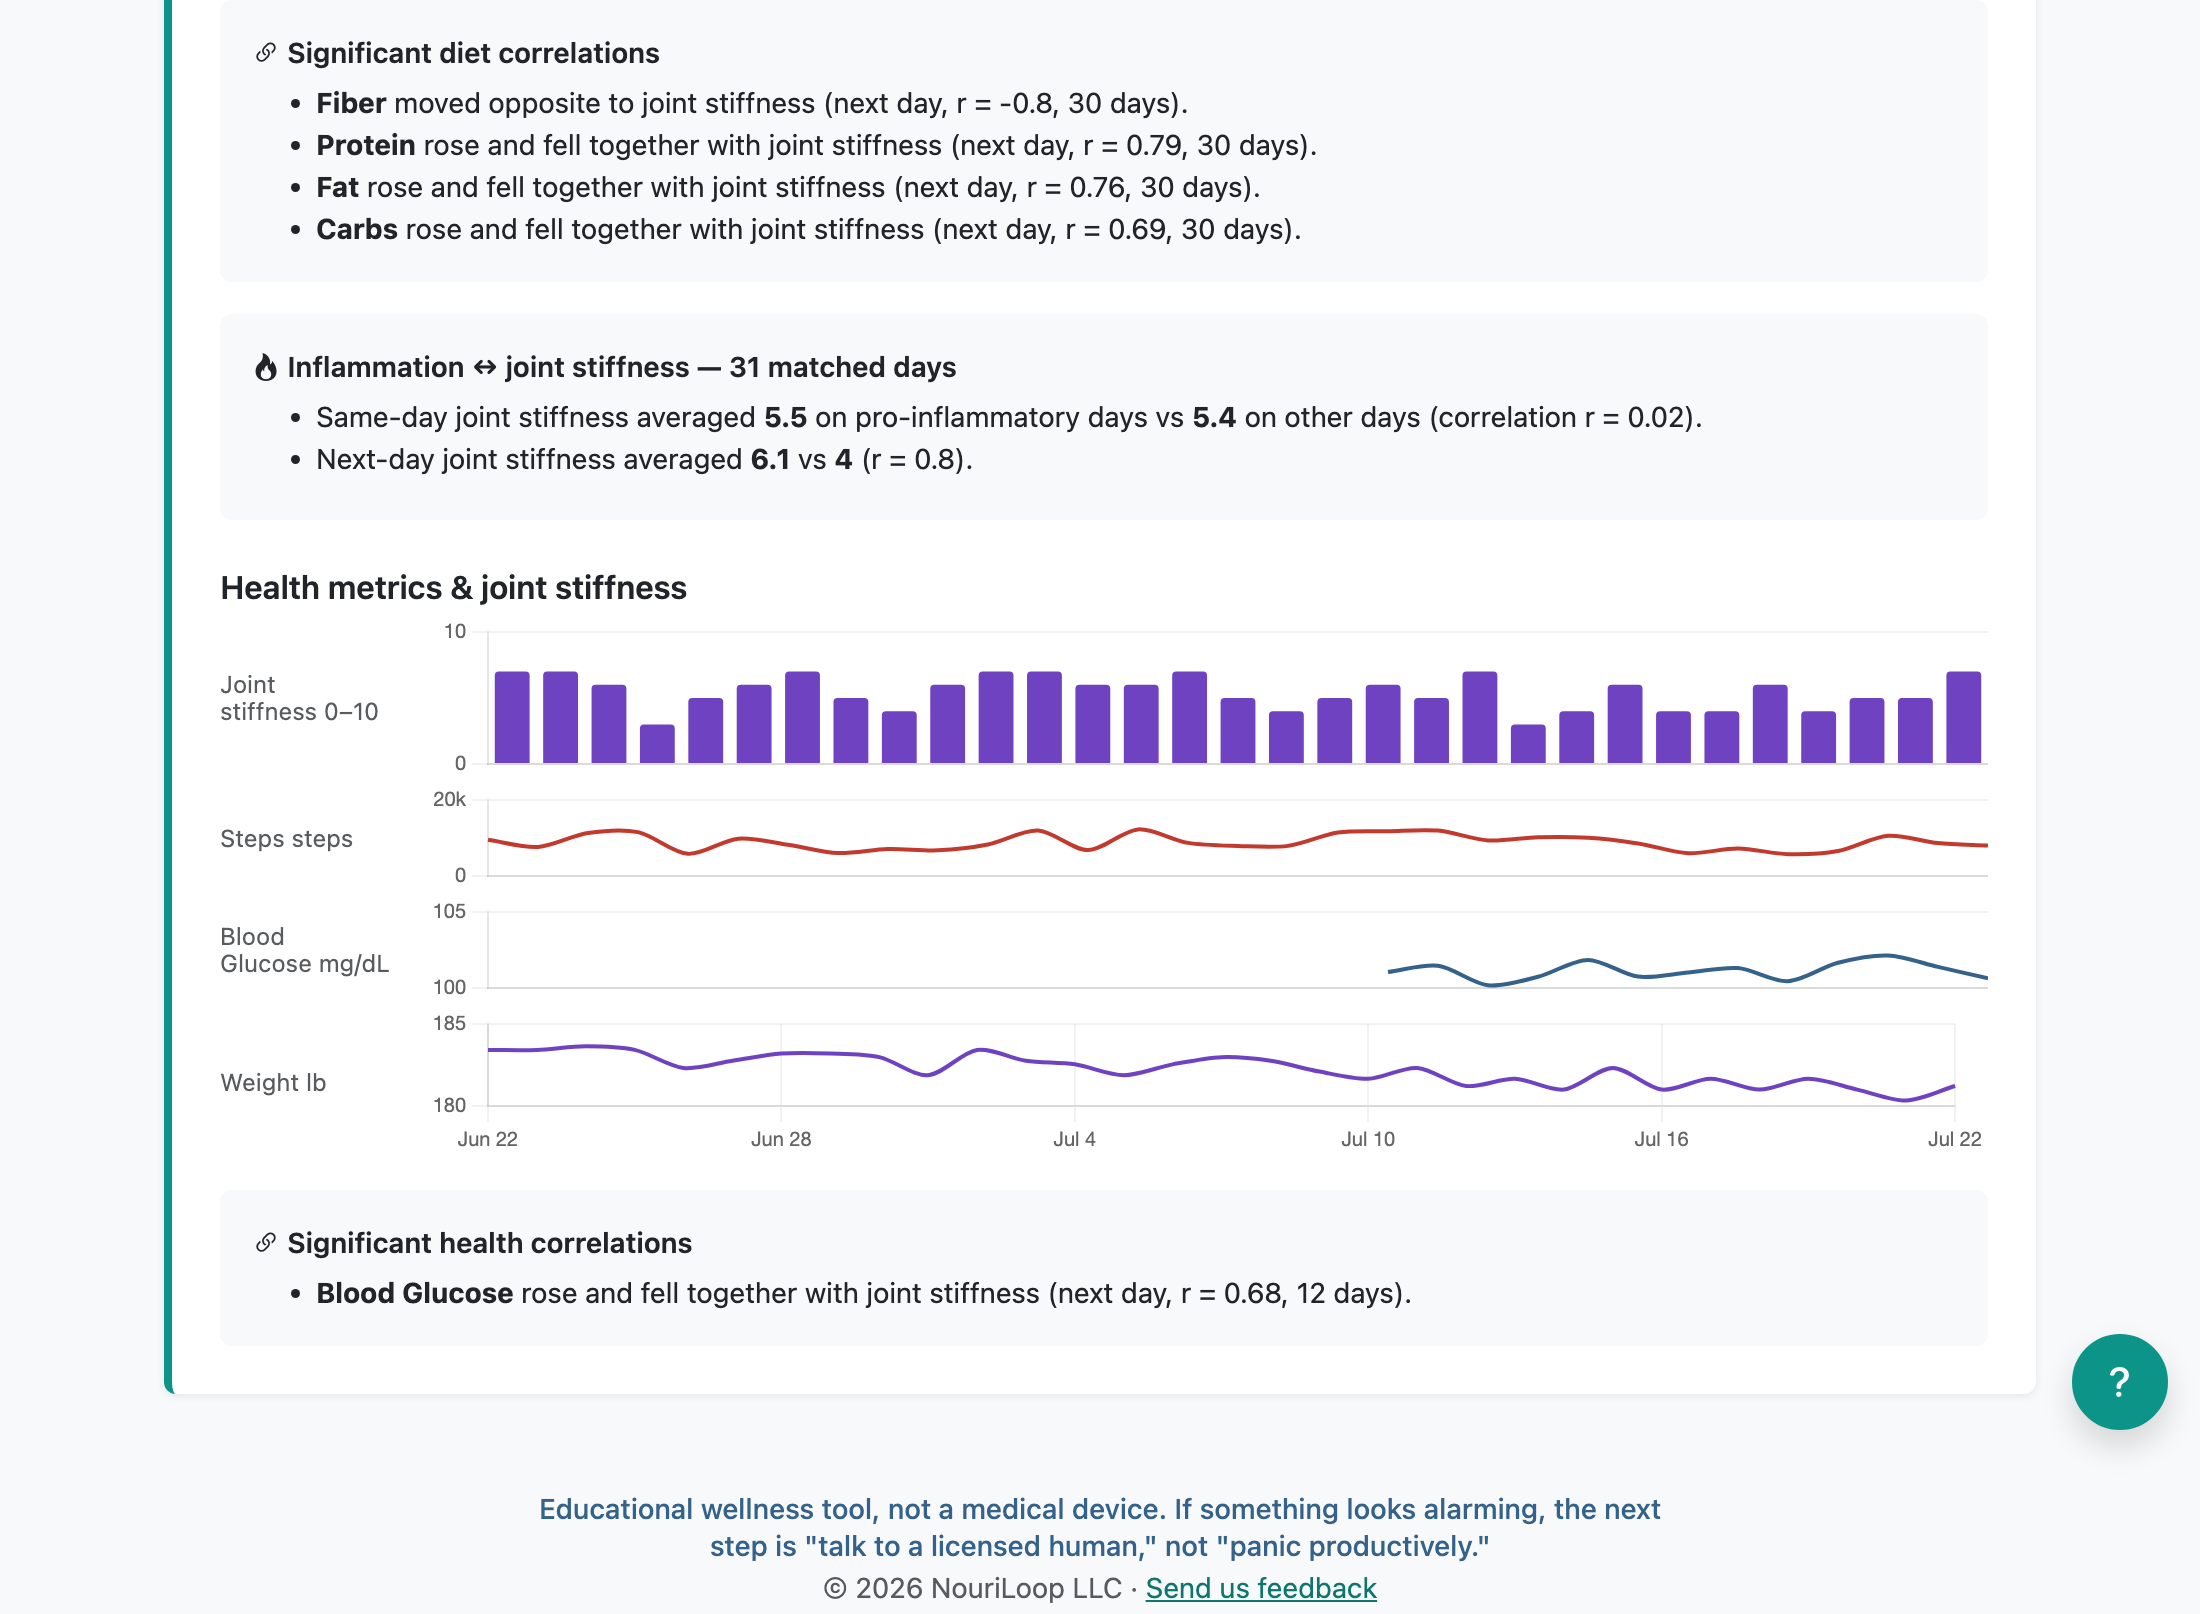
You don't need a statistics background to use this — here's the plain-language version of what's checked before a factor makes that list:
- Enough days to trust. There have to be at least 7 days where you logged both the symptom and the factor. One unusually good or bad day can't fake a pattern that needs a week or more of days lining up.
- Not just a coincidence. NouriLoop runs a standard statistical test that asks: "if there were really no connection here, how likely is it we'd still see a pattern this strong just by luck?" A factor only makes the list when that chance is under 5% — what statisticians call p < 0.05.
The r number next to each factor (like r = 0.6) says how tightly the two move
together, from −1 (perfectly opposite — one goes up as the other goes down) through
0 (no relationship) to +1 (perfectly together). The closer to −1 or +1, the
stronger the pattern. And same-day vs. next-day just tells you when it showed up — sometimes
what you eat today doesn't affect a symptom until tomorrow, so NouriLoop checks both.
One more thing worth remembering: these are descriptive, not causal. A significant correlation is a good lead for your own experimenting — it doesn't prove that factor is causing the symptom, and it isn't a diagnosis.
Symptom tracking is optional and entirely opt-in — nothing shows up until you enable a symptom, and a relationship panel needs a few logged days before it has anything to chart.
Related:
Still stuck? Browse all help topics.